In the world of fixed-income investments, one thing is certain — interest rates matter. They have the power to influence returns, risk, and overall portfolio performance. For investors in Compound Real Estate Bonds™ (CREB), understanding how to model cash flows under different interest rate scenarios isn’t just about number-crunching — it’s about making informed, forward-looking investment decisions.
CREB offers a unique opportunity for investors to earn daily compounding returns up to 8.5% APY, backed by U.S. real estate and treasuries. But even in a structured investment like CREB, where returns are steady and transparent, understanding how interest rate environments can affect cash flow projections helps investors see the bigger financial picture — particularly if they are comparing CREB’s performance with other yield-based assets.
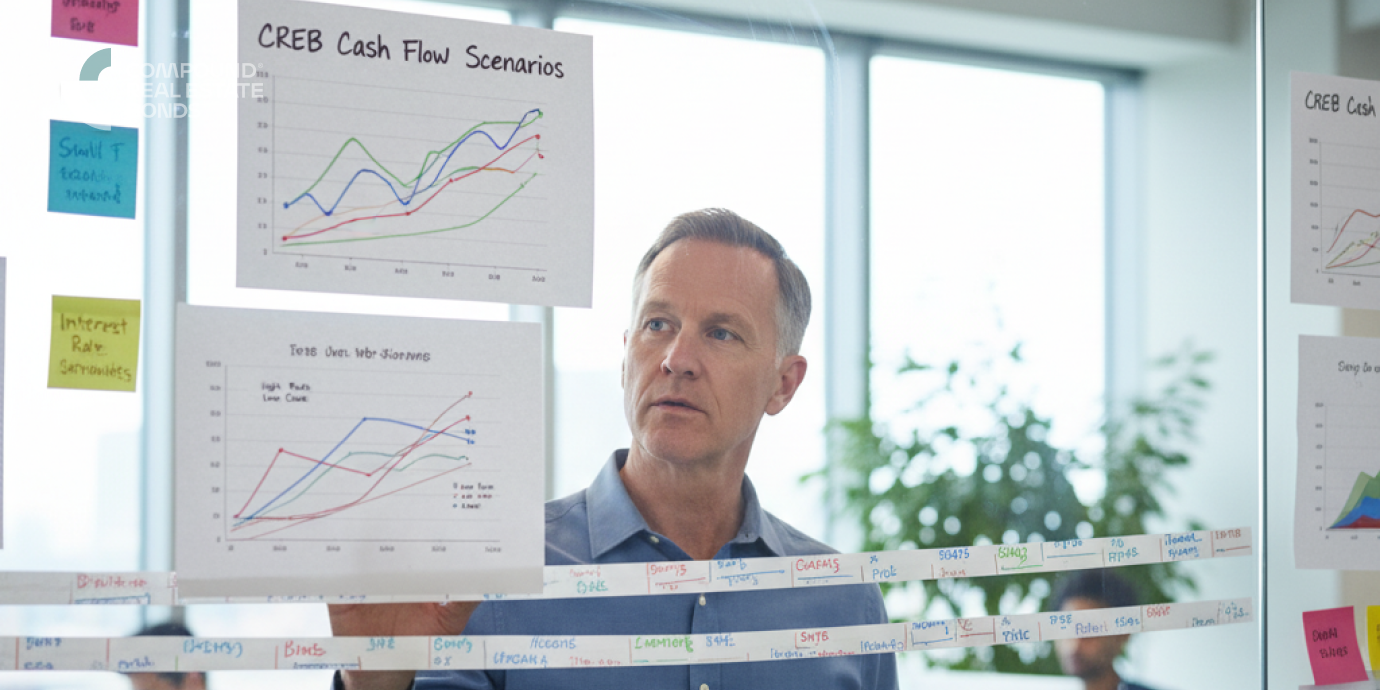
In this blog, we’ll walk through what CREB is, how its cash flows work, why interest rates play a critical role, and how to model cash flows step-by-step under different rate scenarios. By the end, you’ll have a clear understanding of how to project, analyze, and interpret CREB returns in varying economic conditions.
What is CREB?
Compound Real Estate Bonds™ (CREB) are a modern, fixed-income investment product designed for individuals seeking stability, growth, and liquidity — all in one place. These digital bonds allow investors to earn up to 8.5% APY through automated compounding, without the typical restrictions of traditional bonds.
Here’s what makes CREB stand out:
- Daily Compounding Returns: Interest is calculated and added to your balance daily, accelerating growth.
- No Lock-ins: Investors can withdraw anytime, maintaining liquidity.
- Auto-Investing & Round-Up Features: CREB automates wealth-building by allowing users to reinvest earnings and round up spare change from daily transactions.
- Backed by U.S. Real Estate & Treasuries: CREB offers the safety of asset-backed investing.
- Zero Hidden Fees: Transparent, predictable, and designed for simplicity.
CREB essentially acts like a hybrid between a real estate-backed savings bond and a high-yield account, offering passive investors a steady path to wealth accumulation without volatility.
Understanding CREB Cash Flows
Before modeling cash flows, it’s important to understand what they represent in the context of CREB.
1. Definition of Cash Flow
In simple terms, cash flow represents the movement of money — inflows and outflows — over a given period. For CREB, this typically includes:
- Inflows: Investor deposits, reinvested interest (compounding), and returns earned on real estate-backed instruments.
- Outflows: Withdrawals by investors, administrative costs, or returns paid out to investors.
2. Cash Flow Characteristics of CREB
CREB’s cash flows differ from traditional bonds because of its automated compounding and liquid nature:
- Fixed Interest Rate (APY): The return rate (e.g., 8.5%) determines daily earnings.
- Continuous Reinvestment: Unlike traditional bonds that pay periodic coupons, CREB compounds returns daily.
- Flexible Withdrawals: Investors can redeem part or all of their investment at any time.
- No Maturity Period: CREB is designed for ongoing investment rather than a fixed end date.
3. Example: Simple CREB Cash Flow
Let’s assume:
- Investment: $10,000
- Annual Interest Rate (APY): 8.5%
- Compounding: Daily
The daily interest rate is 8.5% ÷ 365 = 0.02329% per day.
After one year:
Future Value=10,000×(1+0.0002329)365=10,884.42Future\ Value = 10,000 × (1 + 0.0002329)^{365} = 10,884.42Future Value=10,000×(1+0.0002329)365=10,884.42
So, the cash flow after one year is $10,884.42, representing an effective yield of 8.84%, slightly higher than the nominal rate due to compounding.
This model can then be adapted to different interest rate environments — which brings us to the next key concept.
Why Interest Rates Matter in CREB Projects
Interest rates serve as the heartbeat of financial markets, influencing the cost of capital, bond yields, and real estate valuations. For CREB investors, understanding this relationship is crucial.
1. Impact on Real Estate-Backed Investments
CREB’s underlying assets — real estate and treasuries — are sensitive to interest rate movements.
- When rates rise: Borrowing costs for property developers and homebuyers increase, which may slow down real estate demand and affect asset values.
- When rates fall: Borrowing becomes cheaper, often boosting real estate prices and improving CREB’s underlying asset stability.
2. Effect on Cash Flow Expectations
While CREB offers a fixed return to investors, changes in market interest rates influence the opportunity cost of holding CREB compared to other assets.
For instance:
- If market rates drop to 4%, CREB’s 8.5% APY becomes extremely attractive — increasing inflows and cash stability.
- If rates surge to 10%, investors may explore higher-yield alternatives — leading to possible outflows or rebalancing.
3. Inflation and Real Return
Interest rates often rise in response to inflation. Modeling cash flows under these scenarios helps investors understand real returns — i.e., returns adjusted for inflation.
To learn more about inflation, read this: What is Inflation
For example:
- Nominal return: 8.5%
- Inflation: 3%
- Real return ≈ 5.5%
Modeling helps you project whether CREB maintains its appeal under changing macroeconomic conditions.
Step-by-Step Guide to Modeling CREB Cash Flows
Since Compound Real Estate Bonds™ (CREB) offers a fixed 8.5% APY, modeling its cash flows is relatively straightforward compared to variable-rate investments. The goal isn’t to forecast changing rates but to understand how fixed compounding returns translate into steady growth over time — and how your wealth accumulates based on your investment amount, time horizon, and compounding effect.
Here’s a step-by-step breakdown of how to model CREB’s predictable, fixed-rate cash flows:
Step 1: Establish Your Investment Inputs
Start with the core assumptions that define your investment scenario:
- Principal (P): The initial investment amount (e.g., $10,000).
- Annual Interest Rate (r): 8.5% APY (fixed).
- Compounding Frequency (n): Daily.
- Investment Duration (t): Period you plan to hold the investment (e.g., 1 year, 3 years, 5 years).
These inputs form the foundation for your cash flow model.
Step 2: Apply the Daily Compounding Formula
CREB compounds interest daily, which means your returns grow faster than with monthly or annual compounding.
The formula is:
Future Value=P×(1+rn)n×tFuture\ Value = P \times (1 + \frac{r}{n})^{n \times t}Future Value=P×(1+nr)n×t
Where:
- P = Principal investment
- r = Annual rate (8.5% = 0.085)
- n = 365 (daily compounding)
- t = Time in years
For example, if you invest $10,000 for 1 year:
Future Value=10,000×(1+0.085/365)365=$10,884.42Future\ Value = 10,000 \times (1 + 0.085/365)^{365} = \$10,884.42Future Value=10,000×(1+0.085/365)365=$10,884.42
That’s an effective annual yield (EAY) of approximately 8.84%, thanks to daily compounding.
Step 3: Create a Monthly Cash Flow Schedule
Even though CREB compounds daily, modeling it monthly provides clarity and easier tracking. Here’s what a one-year monthly breakdown might look like:
Image
This schedule helps visualize consistent compounding growth — your balance increases every month, and each new interest calculation is based on a slightly higher principal.
Step 4: Model Different Holding Periods
The power of CREB lies in compounding over time. Let’s see how a $10,000 investment grows with a fixed 8.5% APY:
Images
The longer you stay invested, the more exponential your returns become — all while enjoying the safety and liquidity of a real estate-backed product.
Step 5: Incorporate Withdrawals or Auto-Investing
CREB gives you flexibility — you can withdraw anytime or automatically reinvest earnings using its auto-investing feature.
- If you withdraw earnings: You maintain liquidity, but future compounding slows because your balance stops growing.
- If you reinvest: Your returns accelerate, as every earned dollar starts generating its own interest.
To model this:
- Deduct withdrawals from your monthly balance.
- Add reinvested interest to the principal for the next compounding cycle.
This lets you compare how different strategies (withdraw vs. reinvest) affect long-term outcomes.
Step 6: Compare Against External Benchmarks
Even though CREB’s 8.5% APY is fixed, you can still model how it stacks up against other investments like:
- High-yield savings accounts (4–5% APY)
- Government bonds (3–4%)
- Certificates of Deposit (4–6%)
By modeling these side by side, you can visualize the advantage of CREB’s higher fixed return and daily compounding effect.
For instance, after 5 years on a $10,000 investment:
- 4% APY → $12,167
- 6% APY → $13,382
- 8.5% APY (CREB) → $15,084
That’s nearly $3,000 more than the average savings product — without the risk or complexity of market-linked instruments.
Step 7: Add Inflation Adjustments (Optional)
If you want a more realistic picture, adjust your model for inflation to find the real rate of return.
If inflation averages 3%, the real return is:
(1+0.085)/(1+0.03)−1=5.34%(1 + 0.085) / (1 + 0.03) - 1 = 5.34\%(1+0.085)/(1+0.03)−1=5.34%
That means your investment’s purchasing power grows about 5.34% annually after inflation — still a strong, stable performance for a low-risk, asset-backed investment.
Step 8: Visualize Growth Over Time
Creating a simple chart or line graph makes the modeling process more intuitive. Plot your cumulative growth over months or years to visualize how your wealth steadily builds with CREB’s fixed compounding return.
The curve will show a smooth upward slope — a hallmark of stable, predictable growth.
Step 9: Interpret the Results
Finally, analyze what your model reveals:
- How much wealth could you accumulate over your target period?
- How much faster does compounding work compared to simple interest?
- What happens if you reinvest earnings versus withdrawing them?
The takeaway is clear — with CREB’s fixed 8.5% APY, your cash flow model will always show consistent, predictable growth, free from the volatility of fluctuating interest rates.

Conclusion
Modeling CREB cash flows under different interest rate scenarios isn’t just a financial exercise — it’s a roadmap to smarter investing. It allows investors to understand the interplay between compounding returns, liquidity, and macroeconomic conditions.
With daily compounding, zero fees, and flexibility to withdraw anytime, CREB remains a strong choice for those seeking stability and growth — regardless of interest rate fluctuations.
Whether rates rise, fall, or stay flat, the power of consistent compounding and asset-backed security keeps CREB’s value proposition steady for long-term wealth creation.
FAQs
1. How does interest rate affect cash flow?
Higher interest rates increase potential returns on new investments but can reduce the value of existing fixed-rate assets. For CREB, which offers fixed compounding returns, rate changes affect relative attractiveness rather than actual payouts.
2. What’s the typical term for a CREB financing?
CREB investments don’t have a fixed term. Investors can hold their funds for as long as they wish, enjoying daily compounding and the option to withdraw anytime — making it far more flexible than traditional bonds.
3. How to calculate different cash flows?
Cash flows can be modeled using compounding formulas. For CREB, use:
Future Value=P×(1+rn)n×tFuture\ Value = P × (1 + \frac{r}{n})^{n×t}Future Value=P×(1+nr)n×t
Adjust “r” to reflect different interest rate scenarios and “t” for different time horizons.
4. How is interest treated in a cash flow statement?
Interest earned through CREB is considered operating income and contributes to positive cash inflows. Since it compounds automatically, it’s reinvested unless withdrawn, enhancing the overall portfolio growth.


.png)